Key Takeaways
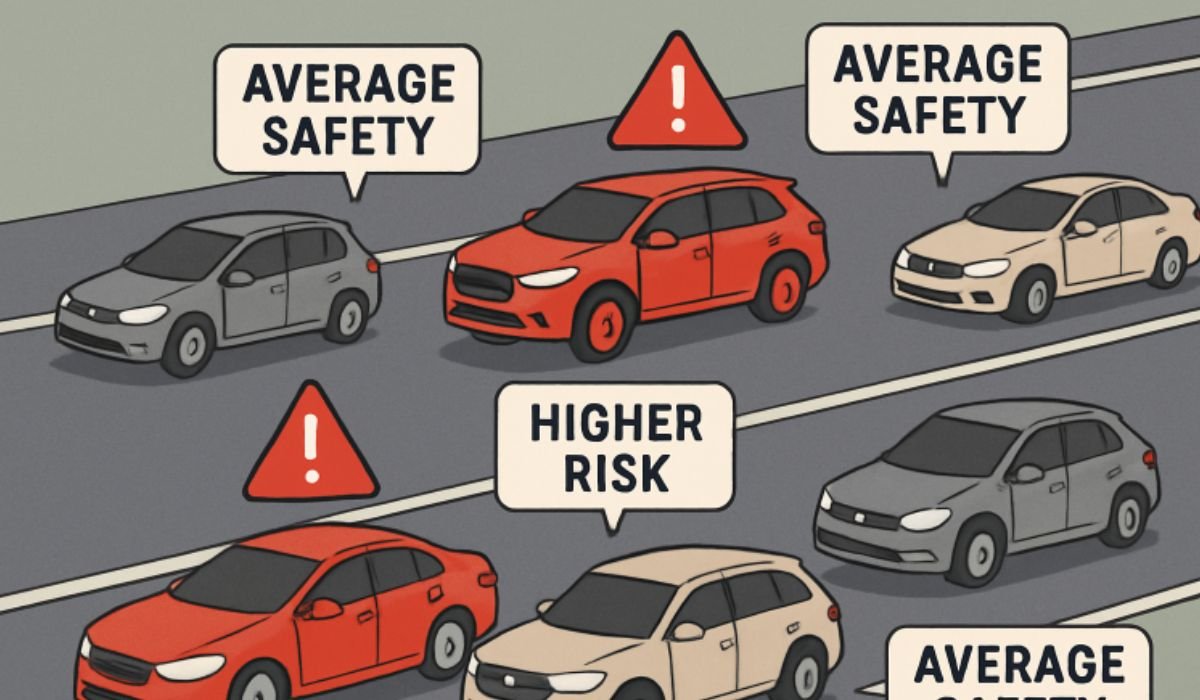
- Specific car models have fatality rates far above the industry average, underscoring the need for careful research when purchasing a vehicle.
- Fatality rates depend on more than just crash-test scores—real-world data and driver behavior also play major roles.
- Vehicle design, weight, and even consumer driving habits all contribute to overall vehicle safety.
- Staying informed about high-risk vehicles can help buyers make safer choices on the road.
Table of Contents
- Introduction
- Understanding Fatality Rates in Vehicles
- Top 10 Car Models with the Highest Fatality Rates
- Factors Contributing to High Fatality Rates
- Comparing Crash Test Ratings and Real-World Data
- Implications for Consumers
- Conclusion
Introduction
When choosing a new vehicle, most buyers prioritize safety—but not all cars are created equal when it comes to real-world risk. Recent studies have made it clear that some vehicles carry a significantly greater risk of fatality, highlighting the need for a comprehensive data review before making a purchase. Interested drivers can compare fatality rates by sedan and SUV to see how particular models stack up and make a more informed choice. Though automotive safety technology continues to evolve, some car models remain at the top of the list of fatal accident statistics. These numbers aren’t just about the vehicle’s crash test ratings, but also how the car fares on real streets, in the hands of typical drivers, and across a variety of conditions.
Fatality rates give a much-needed perspective into the actual risks associated with different makes and models—information that can help prevent tragic outcomes and guide buyers toward safer options.
Understanding Fatality Rates in Vehicles
Fatality rates serve as an objective metric for estimating the likelihood of a fatal accident for a specific car model based on national data. Typically expressed as the number of fatalities per billion vehicle miles traveled, this figure enables fair comparisons across makes, models, and segments, regardless of popularity or sales volume.
By standardizing the data, researchers can flag specific vehicles that pose unusually high risks. In fact, publications such as Fox 2 Now have highlighted 23 of the most dangerous cars on the road using these statistics, illustrating how vehicle design, safety equipment, and other factors can significantly influence outcomes. The metric accounts for accidents involving multiple variables, including vehicle design, safety equipment, driver demographics, and driving environments, offering a broader, real-world understanding than crash tests alone can provide.
Factors Contributing to High Fatality Rates
High fatality rates are rarely the result of a single shortcoming. Instead, they typically stem from a mix of the following:
- Vehicle Size and Weight: Smaller, lighter vehicles generally provide less protection in severe crashes than larger, heavier models. Vehicles that prioritize affordability and fuel efficiency often cannot absorb crash forces as effectively as larger, sturdier vehicles.
- Vehicle Purpose and Driver Behavior: High-performance vehicles tend to attract drivers who may drive more aggressively, thereby increasing both the likelihood and severity of crashes.
- Crash Test Versus Everyday Use: Some vehicles earn high marks from safety agencies in crash tests, but real-world conditions—road types, weather, traffic congestion, and driver behavior—can significantly affect actual fatal outcomes.
- Advanced Safety Features: Not all vehicles come equipped with the same level of advanced safety technologies. Missing features such as automatic emergency braking or robust side-impact protection can further elevate risks in certain vehicles.
Comparing Crash Test Ratings and Real-World Data
A key takeaway from fatality data is that excellent crash-test scores do not always translate into real-world safety. Agencies conduct rigorous, scenario-driven crash tests on new vehicles, which can inform consumer confidence. However, these controlled environments cannot account for every factor experienced on public roads, such as distracted driving or vehicle maintenance issues.
Even vehicles with strong crash-test performance can show elevated fatality rates in real-world statistics. This highlights the importance of supplementing lab-based safety data with broader fatality statistics and considering the full spectrum of risks drivers face daily.
For more about the influence of real-world data versus crash test results, you can read this Time feature on auto safety discrepancies.
Implications for Consumers
The data underscores an important point: when shopping for a vehicle, it is crucial to consider real-world fatality statistics alongside crash-test scores. Comparing these sources provides a more comprehensive understanding of actual road safety, helping you avoid models that present higher risks.
Practicing defensive driving, consistently using safety restraints, and ensuring that your vehicle’s safety systems are functioning properly will further reduce your risk, regardless of the vehicle you choose. Your actions behind the wheel are as pivotal to your safety as any technological feature.
Continued improvements in active safety technology, stricter regulations, and increased public awareness can help reduce fatality rates over time. Until then, an informed approach to vehicle selection remains one of the best ways to protect yourself and your loved ones.
Conclusion
Choosing a vehicle is about more than aesthetics, budget, or loyalty—it’s about safety. Comprehensive fatality data shows significant variation across different vehicles and underscores the importance of considering all relevant safety information before making a purchase. By staying informed and practicing safe driving, you can minimize your risks and protect those most important to you.
YOU MAY ALSO LIKE: How Financial Modeling Skills Are Shaping Modern Finance Careers

